In an era where technology shapes businesses and schools, data analysis and computational thinking aren’t just for Data Scientists and Software Engineers—they’re vital for nearly every profession. These skills empower students to solve problems systematically, make informed decisions, and fuel innovation in business and education. By breaking down complex challenges, recognizing patterns, and using data to guide actions, students build a toolkit for success. For example, visualizing trends with bar graphs or streamlining processes through algorithmic thinking creates smarter, more efficient solutions. Mastering these skills enhances learning, transforms business processes, and can be taught effectively, preparing students to continue to shape and adapt to a tech-driven future.
What Are These Skills?
Data Analysis
Data analysis is a foundational skill for building strong data literacy, enabling individuals to examine datasets and uncover meaningful insights. This process involves identifying patterns, trends, and relationships using statistical techniques and tools, transforming raw numbers into actionable knowledge (Data Literacy in STEM | TEA, 2023). Interpreting data is essential for making informed, data-driven decisions, and visual representations like graphs play a critical role in this process. The choice of representation shapes students’ analytical abilities, with distinct tools suited to different types of data.

For example, bar graphs excel at displaying categorical data, where the order of points doesn’t matter. They are particularly effective for comparing discrete categories to highlight relative quantities at a glance (Rogers, n.d.). An example of this could be comparing sales across product lines or customer preferences. By working with bar graphs, students sharpen their ability to compare and contrast, a skill valuable for overall decision-making. In contrast, scatter plots are ideal for continuous data, where the sequence of results matters. They reveal relationships between variables, showing whether one predicts another or if they vary independently (Rogers, n.d.). This makes scatter plots powerful for spotting trends and correlations, skills essential for predictive analysis and understanding complex business data, such as forecasting inventory need or customer behavior.
Computational Thinking
Computational thinking is a problem-solving process that breaks complex challenges into smaller, manageable parts, devising systematic solutions similar to how a computer operates (Franchitti et al., 2024). It acts as a bridge between a problem and its resolution, relying on predetermined steps—or algorithms—to achieve a goal. Much like coding for a machine, this approach empowers students to craft solutions that are clear to both humans and computers, promoting effective problem-solving (Franchitti et al., 2024).
Despite its name, computational thinking extends beyond technology, serving as a versatile framework across disciplines. Whether someone is learning to tie their shoes, following a recipe out of a cookbook, or working through a math problem, you’re already using its core principles: breaking things down, spotting patterns, and thinking through steps logically. When students develop this mindset, they build the skills to tackle any challenge, from creating a digital tool to streamlining a process.
How They Work Together
Data analysis and computational thinking work hand in hand to solve real-world problems, especially when integrating technology into education or business processes. Data analysis kicks things off by uncovering the facts — whether through surveys, data collection, or visualizations — to highlight what needs attention. For example, a survey might reveal bottlenecks in a business workflow, giving you the raw insights to work with.
That’s where computational thinking steps in. It helps break down those insights, guiding problem-solving strategies to test workarounds, integrate tools like APIs, and refine solutions. Together, they create a powerful cycle — data analysis shows you the “what,” and computational thinking figures out the “how” — leading to innovations like automated systems or more efficient operations.
How These Skills Help Students
To thrive in education and the workforce, students need data literacy and computational thinking skills, especially in STEM fields. These abilities enable them to understand, use, and communicate data effectively, equipping them with the tools to solve complex problems and make informed decisions across disciplines. By mastering data analysis and computational thinking, students develop a versatile skill set that enhances their analytical, problem-solving, and decision-making capabilities.
Analytical Skills: Spotting Patterns and Understanding Information
Data analysis helps students make sense of information by interpreting visuals like graphs and identifying meaningful patterns (Data Literacy in STEM | TEA, 2023). For example, recognizing sales trends or spotting anomalies in test results gives students the insight to make evidence-based claims. This pattern recognition is essential for troubleshooting issues and refining processes (Data Literacy in STEM | TEA, 2023).
A key component of this process is decomposition, which is breaking complex problems or concepts into smaller, manageable parts (Franchitti et al., 2024). This analytical approach not only deepens understanding but also simplifies problem-solving, making it a critical skill for tackling complex challenges.
Problem-Solving Skills: Breaking Problems Down and Fixing Them
Data literacy encourages students to think critically, question assumptions, and evaluate the reliability of information (Data Literacy in STEM | TEA, 2023). Computational thinking takes this further, emphasizing understanding concepts over just learning tools or software (Franchitti et al., 2024). It’s not about pure technical mastery, but about blending creativity with structured logic.
Through algorithmic thinking, students learn to break problems into steps, design efficient solutions, and automate tasks when it makes sense. This methodical approach sharpens their logical reasoning and helps them solve issues with precision, whether they’re debugging code or organizing a project.
Decision-Making Skills
At its core, data literacy drives informed decision-making by turning analysis into actionable insights. Whether in personal choices or professional settings, students use data to guide their actions, relying on evidence rather than guesswork (Data Literacy in STEM | TEA, 2023). In fields like engineering and technology, this skill is vital for evaluating system performance against goals, enabling refinements that optimize products and processes (Data Literacy in STEM | TEA, 2023). Computational thinking enhances this by building logical reasoning and metacognitive awareness—understanding how processes work and adapting them for efficiency. Together, these skills allow students to make smart, evidence-based decisions, streamlining workflows and improving outcomes in real-world scenarios (Franchitti et al., 2024).
Using These Skills in Improving Business Processes
Students equipped with data analysis and computational thinking can drive meaningful improvements in business processes through technology. Data analysis grounds decision-making in evidence, enabling companies to craft strategies, cut unnecessary costs, seize opportunities, and act with confidence (Penn LPS, 2022). Computational thinking amplifies this by breaking down complex processes, identifying bottlenecks, and streamlining operations. Automating tasks and refining workflows boosts efficiency, improves performance, and enhances customer satisfaction. Together, these skills turn raw data into actionable improvements, helping organizations integrate technology effectively.
Steps to Apply Skills
To see these skills in action, consider a university facing declining student enrollment, where the admissions department seeks to improve its process with technology. Here’s how data analysis and computational thinking collaborate:
- Break Down Processes (Decomposition):
Since student admissions processes may have many components, identifying the root cause of issues can be challenging. The first step is to divide the process into manageable parts, such as promoting programs, collecting applications, and meeting with prospective students.
- Analyze Data:
After breaking down the admissions process, examine each component to find potential problems. Admissions advisors could analyze recent reports using visual tools like bar graphs or scatter plots to spot trends. For example, they might discover that prospective students drop off after webinars due to unclear next steps. This insight highlights where a technology solution might fit, such as adding an automated follow-up form within the webinar tool.
- Plan Tech Steps:
Once the issue is identified, create a clear, step-by-step plan to implement a solution. For example: “When a webinar ends, prompt attendees to complete a follow-up form, then notify admissions staff.” This sets up automation through the webinar tool, optimizing the process using computational thinking.
- Focus on Key Issues:
As new technology is integrated, it’s essential to prioritize the core problem over minor distractions like small webinar glitches. Integrating new solutions can be complex and overwhelming, so focusing on the most impactful changes ensures meaningful improvements. In this case, simplifying the application follow-up process with automated forms addresses the primary issue without getting sidetracked.
Outcome
In the end, this approach resolves a key part of the admissions process by automating follow-ups within the webinar tool, ensuring prospective students have a clear path to the next steps.
By blending data analysis with computational thinking, businesses and schools can seamlessly integrate technology, cut out inefficiencies, and drive better results. This synergy allows them to track performance indicators, identify areas for continuous improvement, and allocate resources effectively.
Teaching These Skills
Project-Based Learning
One effective way to teach data analysis and computational thinking is through project-based learning, where students collect, analyze, and present data on topics tied to their interests or studies. Inquiry-driven methods like project-based and problem-based learning connect theoretical concepts to real-world applications, significantly boosting data literacy (Schenck & Duschl, 2024). Two iterative frameworks stand out:
- The Design Thinking Process offers a creative problem-solving approach focused on user needs. It follows three phases—understand, explore, materialize—across six subphases: empathize, define, ideate, prototype, test, and implement (Gibbons, 2016). Students apply data analysis during research (e.g., empathize, test) and computational thinking when designing solutions (e.g., ideate, prototype), using decomposition to refine prototypes iteratively.
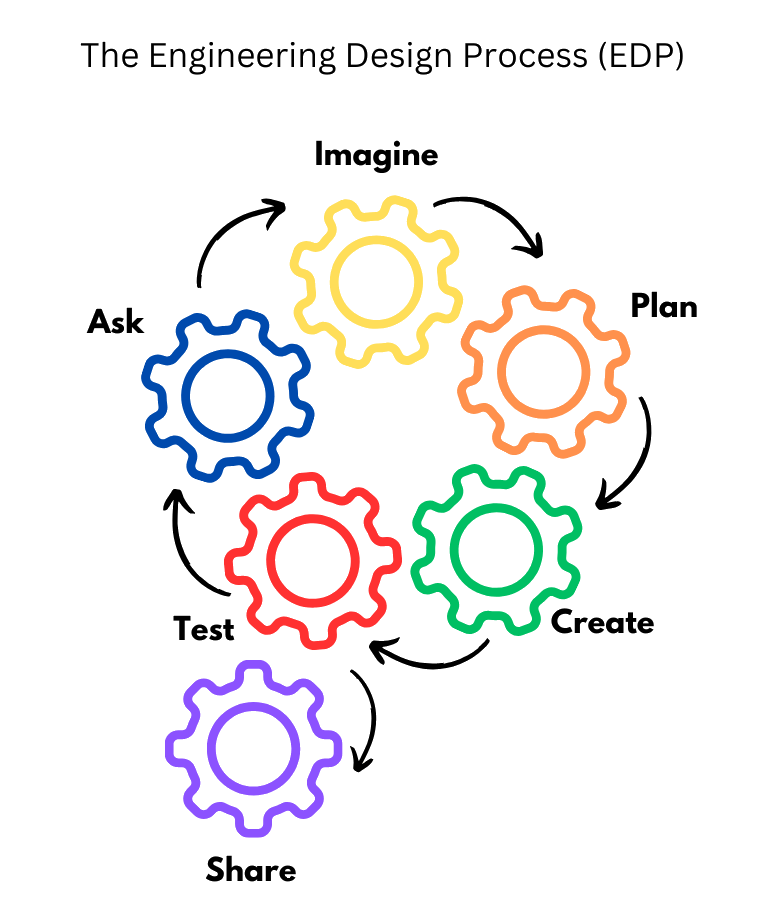
- The Engineering Design Process (EDP) similarly guides students through defining problems, conducting research, and developing solutions, with iterative testing to ensure those solutions meet specific needs. (For a deeper dive into the EDP, check out my other article on the iterative framework.)

Both frameworks embed data analysis and computational thinking at every stage, providing students with hands-on opportunities to build and refine these essential skills through authentic, real-world challenges.
The Use of Graphs (Data Representation)
Graphs are incredibly effective tools for teaching data interpretation, helping students visualize, process, and compare information. Research underscores their impact on comprehension. For instance, one study found that students who worked with graphical data on a test outperformed those who didn’t, emphasizing how graphs can make complex information more accessible and improve understanding (Susac et al., 2017). This is further supported by a study with high school students, where a six-week intervention led to a 16.7% improvement in visual data literacy. Not only did students show gains in identifying variables, but their confidence also grew—demonstrating that frequent exposure to graphs builds competence over time (Suvak, 2017). However, it’s important to note that while skills in identifying variables improved, the same study showed that recognizing patterns remained a struggle. Many students found it difficult to consistently spot trends across different types of graphs, highlighting the challenge of mastering pattern recognition through graphical data alone.
It is suggested that to maximize learning, graphing activities should follow evidence-based principles: use engaging, discipline-specific data; provide explicit instruction; incorporate real-world, messy datasets; encourage collaboration; and emphasize reflection (Gardner et al., 2024). These strategies ensure students not only learn to interpret data but also gain the confidence and critical thinking skills to apply it effectively.
Coding and Debugging
Debugging involves locating and fixing defects (i.e., bugs) in algorithms and processes to ensure they work as expected (Franchitti et al., 2024). Essentially, it’s about identifying the source of the issue and correcting it. Through practice, debugging teaches students how to identify and resolve problems systematically. While graphs alone might not fully develop pattern recognition skills as mentioned earlier, debugging can be a more effective way to accomplish this. By breaking a problem down, students can identify patterns or key differences that help in making predictions or finding shortcuts (Computational Thinking | TEA, n.d.). This process ultimately strengthens students’ ability to decompose and interpret data, enhancing their graph-reading skills.
Debugging also sharpens analytical thinking by requiring students to dissect code, pinpoint flaws, and simplify complexity (Franchitti et al., 2024). It demands attention to detail, as students look over variables and edge cases, and fosters creativity, especially when adapting limited tools to solve business challenges. Altogether, these practices build a strong problem-solving mindset.
Conclusion
In a technology-driven world, data analysis and computational thinking are essential skills that enable students to think critically, solve problems, and innovate across various industries. Data analysis transforms raw information into actionable insights using tools like bar graphs and scatter plots, while computational thinking offers a structured approach to breaking down challenges and creating solutions—whether it’s something as simple as tying shoes or as complex as designing software algorithms. Together, these skills equip students with the ability to analyze, problem-solve, and make informed decisions, helping them optimize business processes—like streamlining university admissions with technology—by pinpointing inefficiencies and implementing data-driven solutions. Teaching these skills through project-based learning, graph interpretation, and debugging code promotes hands-on mastery, resilience, and adaptability. As both business and education continue to evolve, cultivating these competencies ensures students are not only prepared to succeed today but also empowered to shape a smarter, more efficient future.
References
5 key reasons why data analytics is important to business. (2022, October 20). PEN LPS. https://lpsonline.sas.upenn.edu/features/5-key-reasons-why-data-analytics-important-business
Computational Thinking | TEA. (n.d.). Texas Education Agency.
Data Literacy in STEM | TEA. (2023, November 7). Texas Education Agency.
Franchitti, J.-C., Alhosban, A., Buckler, M., Gilberti, J., Gray, S., Hertz, M., Hurd, A., Lin, K., Mukkavilli, S., Nguyen, P., Tayeb, S., Troníček, Z., Wortman, K., & Zahran, M. (2024, November 13). Introduction to Computer Science. OpenStax. https://openstax.org/books/introduction-computer-science/pages/2-1-computational-thinking
Gardner, S. M., Angra, A., & Harsh, J. A. (2024). Supporting Student Competencies in Graph Reading, Interpretation, Construction, and Evaluation. CBE Life Sciences Education, 23(1), fe1. https://doi.org/10.1187/cbe.22-10-0207
Gibbons, S. (2016, July 31). Design Thinking 101. Nielsen Norman Group. https://www.nngroup.com/articles/design-thinking/
Rogers, T. (n.d.). Which Type of Chart or Graph is Right for You? Tableau. Retrieved February 23, 2025, from https://www.tableau.com/learn/whitepapers/which-type-chart-or-graph-right-for-you-ungated
Schenck, K., & Duschl, R. (2024, March 20). Context, language, and technology in data literacy. Routledge Open Research. https://routledgeopenresearch.org/articles/3-19/v1
Susac, A., Bubić, A., Martinjak, P., Planinic, M., & Palmovic, M. (2017). Graphical representations of data improve student understanding of measurement and uncertainty: An eye-tracking study. Physical Review Physics Education Research, 13. https://doi.org/10.1103/PhysRevPhysEducRes.13.020125
Suvak, M. G. (2017). Improving Visual Data Literacy Skills of High School Earth and Space Science Students by Weekly Data Analysis Curriculum. Montana State University.